SURROGATE DATA
TEST
Group: dynamic
analysis
Old
definition:
The
method of surragate data has become a central tool for validating the results
of nonlinear dynamic analysis. The surrogate data method tests for a
statistical difference between a test statistics (e.g. complexity/fractal
metrics) computed for the original time series and for an ensemble of test
statistics computed on linearised version of the data, the so-called
"surrogate data". The major aspects of the surrogate data that need
to be considered are:
1.the
definition of the null hypothesis about the nonlinear dynamics underlying a
given time series
2.the
realization of the null hypothesis, i. e., the generation method for the
surrogate data
3.the
test statistic.
(Ali-Nait, A., Advanced Biosignal Processing, p.
322)
New definition:
Surrogate
data methods are now almost invariably applied to potentially nonlinear time series
data with the aim of discounting more hum-drum linear noise processes as the
source of the observed phenomenon [23]. For the uninitiated, the entire
procedure can be briefly de-scribed as follows. One starts with an observed
time series which is to be tested against the null hypothesis of the surrogate
data test. The standard surrogate data repertoire provides algorithms to test
against the hypotheses of (i) independent and identically distributed noise; (ii)
linearly filtered noise; or (iii) a monotonic nonlinear transformation of
linearly filtered noise. Algorithms for each of these three hypotheses generate
an ensemble of fake (artificial) time series data: the surrogate data. These
surrogate data sets are guaranteed to have both the properties associated with
the underlying null hypothesis and also are otherwise similar to the original
observed data. In other words, these surrogate data are what independent
repeated observations of the process that generated the original data would
yield if that process were consistent with the null hypothesis. Now, one simply
evokes whatever statistic is of interest (correlation dimension is a fairly
orthodox choice) and compares the value of this statistic computed from the
data to the distribution of values elicited from the surrogates. If the
statistic value of the data deviates from that of the surrogates, then the null
hypothesis may be rejected. Otherwise, it may not. Figure I summarises this
process.
Surrogate
data methods are often applied in conjunction with either linear or nonlinear
modelling regimes. In some sense, surrogate data methods are equivalent to
applying specific classes of (usually) parameter free models. In this context
surrogate data methods can even be applied to test the residuals of specific
models [I7]. However, the purposes of hypotheses testing and modelling are
different. A model' will give a wealth of information about features that may
or may not be in the data: the features one deduces from the model are
attributable to that particular description of the data. On the other hand,
surrogate methods provide a rigourous test of whether or not the data belongs
to a particular class of systems. One can then be assured (or at least
persuaded) that the data are amenable to that particular class of models, or
not.
However,
one may still think that it is possible to investigate features of data by
modelling, for example, discrimination between linearity and nonlinearity. One
simple example is as follows. To build time series models, a particularly
convenient class is the pseudo-linear models, which are formed by linear
combination of any type of functions such as linear and nonlinear functions
They have been applied widely for building models of actual time series. When
models we build contain nonlinear functions, one may think that as the data
include nonlincarity, nonlinear functions are selected. On the other hand, when
models contain only linear functions, one may think that as the data are
linear, nonlinear functions are not selected.

v
Older definition is more useful
for general understanding about the word. But mine is more detailed for
mathematical understanding.
OPTICAL-FIBER PYROMETERS
Group:
measurement and process control
Old
definition:
Optical-fıber
pyrometers are one of the most successful optical-Eber sensors in the field of
process control in manufacturing. Typical applications are:
-Casting
and rolling lines in steeland other metal plans
-Electric
welding and annealing
-Furnaces
in chemical and metal plants
-Fusion,
epitaxial growth, and sputtering processs in the semiconductor industry
-Food
processing, paper manufacturing, and plastic processing
(Soloman S., Sensors and Control Systems in
Manufacturing, p.336)
New definition:
A
section of these devices merely use an optical fibre to direct the emitted
radiation to the detector. Strictly speaking, this section of fibre-optic
devices is not a class by itself. The first such sensors used a sapphire rod of
3 mm diameter to pick up the energy from the target and transmit it to a
detector. Contemporary fibre-optic pyrometers use a flexible bundle of glass
fibres with or without a lens. The spectral response of these fibres extends to
about 2 µm,
though sonic materials such as fluorides have a wider band-pass. Some are
useful at target temperatures FIS low as 100 °C. Beyond collection of radiant
energy, fibre-optic glasses can be doped to serve directly as radiation emitters
at hot spots so that the fiber optics serve as both the sensor and the media. A
sapphire probe is commercially available that has the easing end coated by a
refractory metal forming a blackbody cavity. The thin, sapphire rod thermally
insulates and connects to an optical fibre as is shown in Fig. 10.48. A ratio
method may be utilised to determine the temperature.
Fibre-optic
thermometers are especially useful where it is difficult, dangerous or
impossible to obtain or maintain a clear sighting path to the target, as in
pressure or vacuum chambers. Fibre-optic thermometers have also been used to
measure temperatures of turbine blades in gas turbines, and the temperature of
small objects in induction heating coils. Next we pass on to an important
aspect of temperature measurement which is considered necessary for all kinds
of thermal probes. Of course, remote measurements by pyrometers, having no
probes, do not come under its purview.

(Ghosh,
Introduction to Measurements and Instrumentation, pg.348)
v My definition is more sufficient for
explaining how the pyrometer works
MURA
Group: production
| manufacturing wastes
There
is no old definition
New definition:
Mura
refers to unevenness or fluctuation in work, usually caused by fluctuating
production plans. A simple example might be a production line that is producing
difficult models for half the shift and simple models for the second half, so
that workers strain for half the day and coast the other half. The lean system
seeks to reduce mura through heijunka, or production levelling, by mixing
models, for example.
Mura is
traditional general Japanese term for unevenness, inconsistency in physical
matter or human spiritual condition. It is also a key concept in the Toyota
Production System and is one of the three types of waste (Muda, Mura. Muri; it
identifies. Waste reduction is an effective way to increase profitability. Toyota
merely picked up these three words with prefix mu-, which every Japanese know,
as product improvement program or campaign.
Mura is
avoided through Just In Time systems which are based on little or no inventory,
by supplying the production process with the right part, at the right time, in
the right amount, and first-in, first out component flow. Just in Time systems
create a "pull system" in which each sub-process withdraws its needs
from the preceding sub-processes, and ultimately from an outside supplier. When
a preceding process does not receive a request or withdrawal it does not make
more parts. This type of system is designed to maximize productivity by
minimizing storage overhead. For example:
1. The assembly line “makes a
request to,” or “pulls from” the Paint Shop, which pulls from Body Weld.
2. The Body Weld shop pulls from
Stamping.
3. At the same time, requests are
going out to supplliers for specific perts, for the vehicles that have been
ordered by customers.
4. Small buffers accommodate minor
fluctuations, yet allow continuous flow.
If parts or material defects
are found in one process, Just-in-Time approach requires that the problem be quickly
identified and corrected.
(Pascal Dennis, Lean Production Simplified: A
Plain Language Guide to the World's Most Powerful production System, pg. 25)
(David A. Hounshell, From the American System to
Mass Production, pg.486)
v
My definition is satisfactory
for understanding this approach.
PRESENT WORTH
METHOD
Group: evaluation
of engineering alternatives
Old
definition:
The
present worth method uses the equivalent present value of all current and
future cash flows to evaluate the investment proporsal.The future cash are
converted into their present worth by using the appropriate interest
factors.Accordingly,some interest rate must be used in the factors.This
interest rate is decided in advance and represents the rate-of-return criterion
that the company is using to evaulate its investment opportunities.If the
aggregate present worth of the project is positive,the return from the project
exceeds the rate-of-return criterion.If the present worth of the project is
negative,the project does not meet the rate-of-return criterion.
(Groover M.,Automotion,Production Systems and CIM
Practice Hall 1st edition,p. 49)
New definition:
Many
economists prefer the present worth method because it reveals the sum in
today's rupee that is equivalent to a future cash flow stream. For example, Rs.
110 expected one year hence is worth only Rs. 100 today, if the rate of
interest is 10 per cent, compounded annually. This means that Rs. 100 is the
present value of Rs. 110 to be earned one year hence.
In the
present worth method, the present worth of all cash inflows (revenues) is
compared against the present worth of all cash outflows (costs) associated with
an investment project. In this method of comparison, the cash flow of each
alternative will be reduced to time zero by assuming an interest rate i. Then,
depending on the type of decision, the best alternative will be selected by comparing
the present worth amounts of the alternatives. The difference between the
present worth of the cash flows (inflows — outflows) is referred to as the Net
Present Worth (NPW) which determines whether or not the project is a feasible
investment.
Steps
Needed for Present Worth Comparison
The
following are the steps involved in present worth comparison:
1. Estimate the interest rate that
the firm wishes to earn on its investment.
2. Determine the service life of
the project.
3. Ascertain the cash inflows over
each service life
4. Find out the cash overflows
over each service period
5. Calculate the net cash flows
(inflows-outflows)
If
there is a single investment proposal, then the decision whether a project will
be selected or rejected can be made accordingly.
·
If
PW > 0, then the proposal will be selected. A positive NPW means that the
equivalent worth of the inflows is greater than the equivalent worth of the
outflows. So, the project will make profit.
·
If
PW < 0, then the investment project should he rejected. A negative NPW means
the equivalent worth of the inflows is less than the equivalent worth of the
outflows.
·
If
PW= 0, then one should remain indifferent to the investment.
In case
there are mutually exclusive alternatives, then the present worth cash flows
can be calculated by two prominent methods:
·
Revenue-based
present worth
·
Cost-based
present worth
In a
revenue/profit-based cash flow diagram, the profit, revenue, salvage value (all
inflows to an organization) will be assigned with a positive sign. The costs
(outflows) will be assigned with a negative sign. In a cost-based cash flow
diagram, on the other hand, the costs (outflows) will be assigned a positive
sign and the profit, revenue, salvage value (all inflows), etc. will be
assigned a negative sign. In revenue-based cases, the decision is to select the
alternative with the maximum profit. Thus, the alternative with the maximum
present worth will be selected. In cost bases cases, if the decision is to
select the alternative with the minimum cost, then the alternative with the
least present worth amount will he selected.
(Sasmita Mishra, Engineering Economics and
Costing, pg.96)
v
My definition includes more
information so makes it easy to understand the meaning of the method.
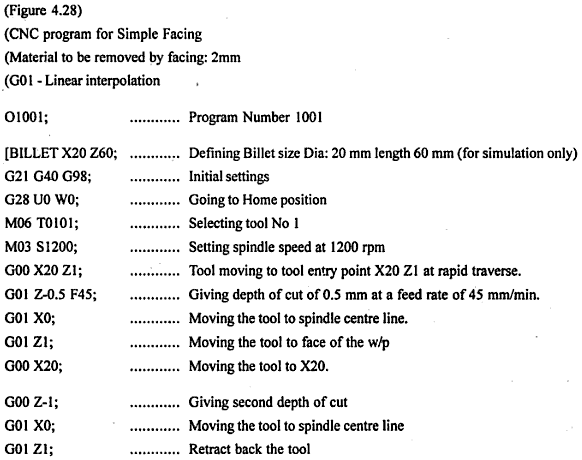
FACING CYCLE (IN
G-CODING)
Group: automation
|numerical control and programming
There
is no old definition
New definition:
The
facing cycle is used when the major direction of cut is along the x axis. The
cycle causes the profile to be roughed out by facing control passes on to after
the last block of the profile. Two G72 blocks are needed to specify all the
values.


Sample:
Write a
manual part program for simple facing operation for the given component.


(C. Elanchezhan,G. Shanmuga Sundar, Computer Aided
Manufacturing, 420,427)
v My definition is sufficient
Great tips, many thanks for sharing. I have printed and will stick on the wall! I like this blog. Deep Draw
ReplyDelete